SDGs and our Metrics
Our collective global to-do list to build a better future
for everyone by 2030, as agreed by 193 nations.
Why?
Everyone wants to make a difference.
What can we do to make a difference? How will we know that we have actually succeeded? How do we consolidate the impact of fragmented efforts around the world? We want to quantify and aggregate impact to show how each of us are making a difference.
The United Nations Sustainable Development Goals (SDGs) are the blueprint to achieve a better and more sustainable future for all. To achieve the SDGs we need global coordination between governments, businesses, philanthropy and civil society. We can only achieve the SDGs with a collaborative approach.
What?
Agreed by 193 countries in 2015, the 17 SDGs underpinned by 169 targets and 244 indicators, are the world’s to do list for the next 10 years. Click on the individual cards below to learn more about the SDGs.
SDG Profile Simulator
Generate your SDG profile by choosing topics and actions for each topic relating to your organisation’s work, and see how our algorithms link SDGs to Five Pillars.
UN Global Goals Index
Country governments, businesses, investors & philanthropists can use this map to enable strategic & effective collective global impact.
The color shows sum of Global Index Rank which ranges from 1 to 156 for each country. The color depicts relative needs intensity from red (high intensity) to green (low intensity).
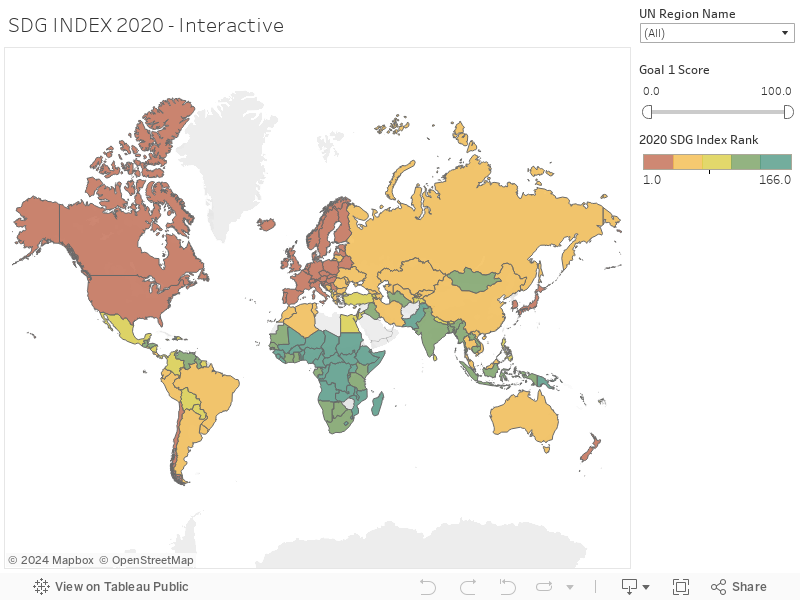
Data sourced from Sachs, J., Schmidt-Traub, G., Kroll, C., Lafortune, G., Fuller, G. (2019): Sustainable Development Report 2019. New York: Bertelsmann Stiftung and Sustainable Development Solutions Network (SDSN). This work is licensed under a Creative Commons Attribution 4.0 International License.
How?
The SDGs can come across as too generic and too many. To understand and align the philanthropic contributions towards a sustainable 2030 may seem too complicated and unrealistic. To address this, we have decoded the complexity of the SDG framework to make them relevant, easy to understand and effective to measure.
The algorithms which combine the use of SDG targets and indicators data at global and country level underpin the impact we project through the unique MaanchMetrics for every project listed for funding. MaanchMetrics are designed to make it easy and transparent to understand impact and make the process harmonised and transparent. with more accessible and specific data organisations use to describe their projects.
The MaanchMetrics also go beyond the SDGs framework to show funders how projects and activities will make a positive difference. Maanch aims to aggregate data and bring transparency, discoverability and harmony of information to the philanthropic sector.
Our visualisations
From the data we collect at a project level, combined with SDG baseline data, we process MaanchMetrics to give the following insights:
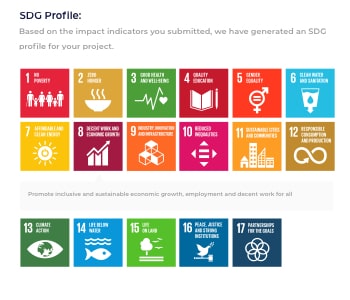
SDG Profile
We generate a bespoke SDG profile for each project based on the causes they address, the approach they adopt and the impact indicators organisations submit.
This SDG profile helps funders understand which SDGs will be directly influenced by funding the project. It highlights the interrelation among the 17 SDGs.
For example, funding a women’s education project in rural India will not only address Goal 4: Quality Education but will also impact Goal 1: Ending poverty, Goal 5: Gender Equality, Goal 8: Decent Work and Sustainable Economic Growth and so on.
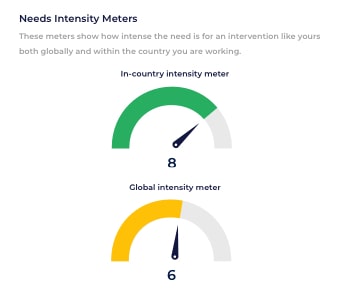
SDG Relevance Ranking (Global and In-country Needs Intensity Scores)
The SDG relevance rankings are designed to help you understand the significance of the topic or cause addressed by a project from a global and a country perspective. For funders wishing to have global impact the global ranking is more relevant, and for funders wishing to have local impact the country ranking is more relevant.
Global ranking shows the relevance of a project on a global scale. A high number indicates there is a higher demand for the project in order to achieve the SDGs by 2030.
In-country ranking shows the relevance of a project within the country. A higher number means this project will enable the country to move towards achieving the SDGs. A lower number doesn’t mean less impact, it simply means the country may have other topics that need addressing to achieve the SDGs by 2030.
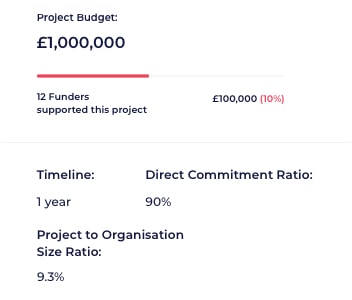
Financials
The two auto-generated ratios are designed to help funders get an overview of the project financials. They can be important markers to understand organisational effectiveness and overall capacity to deliver.
Direct Commitment Ratio shows the percentage of funds that will go directly to the topic/cause of the project in comparison to the amount that will cover organisational overheads.
Project to Organization Size Ratio shows the size of the project in comparison to the most recent annual income of the organisation as reported to the regulators.
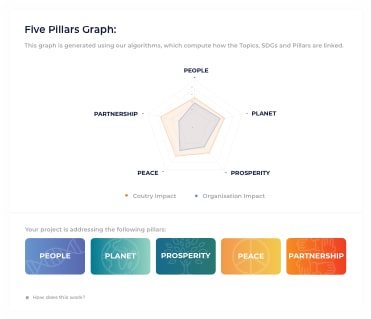
5 Pillar Graph
This graph is designed to highlight where we stand now with regards to each of the 5 Pillars: People, Planet, Prosperity, Peace, Partnership, globally and in a specific country. A fully colored graph would indicate we have achieved a sustainable future for all.
The global graph shows the global average for each of the 5 Pillars and the country graph indicates the country average. Most projects address all 5 Pillars.
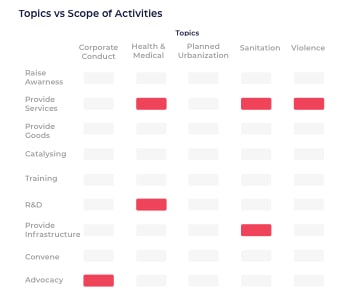
Topic and Activity Grid
When submitting a project, we ask organisations to list the topics their project will address and which activities they will undertake to achieve the desired impact.
With this information we generate the Topic and Activity Grid. This grid is designed to give funders a visual overview of activities that will be funded.
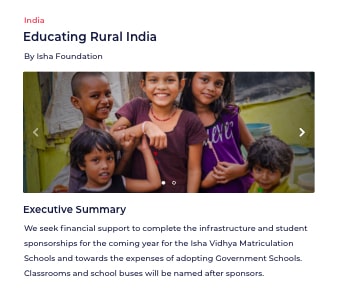
Project Narrative
For each project, alongside quantitative information, organisations share an executive summary, short and long term outcomes, and details on the activities they plan to undertake.